
Streamlining System Monitoring with Loki, Promtail, and Grafana on Debian/ubuntu
Introduction
In the last blog, we already saw how to set up Grafana. If you haven't read it yet, please do so first.
In the world of modern IT operations, system administrators and DevOps teams face the ever-growing challenge of managing and monitoring complex systems. As applications and infrastructure become more distributed and dynamic, having comprehensive and real-time visibility into system health and performance is crucial. This is where system logs come into play, and tools like Loki, Promtail, and Grafana are leading the charge in simplifying the process.
In this blog post, we'll explore how these powerful open-source tools can help you centralize, store, and visualize system logs effectively, providing actionable insights to keep your systems running smoothly.
Understanding the Components
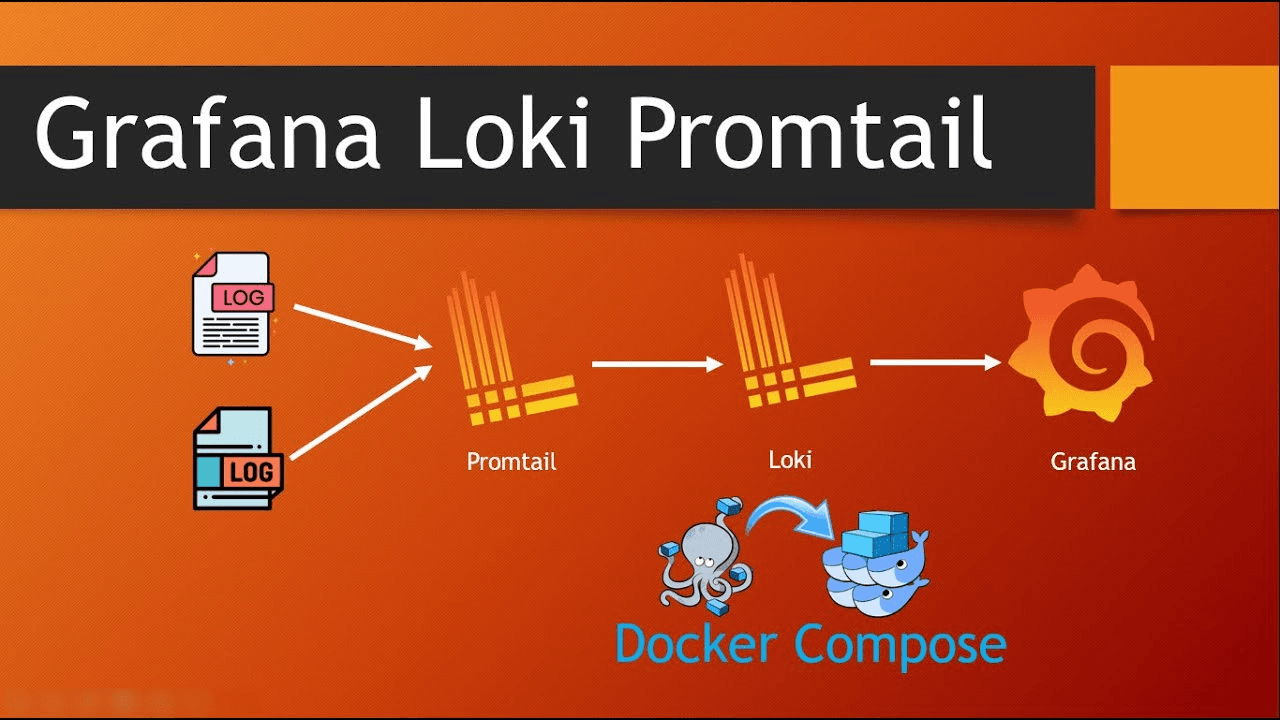
Before we dive into the practical aspects, let's briefly understand the key components of our monitoring stack:
Loki: Loki is a horizontally scalable, multi-tenant log aggregation system inspired by Prometheus. It is designed to store and query logs efficiently. Loki enables you to query logs using label-based filtering, making it easy to find specific logs among vast amounts of data.
Promtail: Promtail is a lightweight agent for collecting logs and sending them to Loki. It can tail log files, and scrape log output from Docker containers, Kubernetes pods, and more. Promtail enriches log entries with labels, allowing for easy categorization and querying.
Grafana: Grafana is a popular open-source monitoring and observability platform. It provides a user-friendly interface for creating dashboards, and alerts and visualizing data from various sources, including Loki.
Setting Up Loki and Promtail
Now, let's get our hands dirty and set up Loki and Promtail to collect and store system logs:
Note: Do not download LogCLI or Loki Canary at this time. LogCLI allows you to run Loki queries in a command line interface. Loki Canary is a tool to audit Loki's performance.
Install Loki: You can install Loki on your server using a package manager, Docker, or even deploy it in a Kubernetes cluster. Loki's configuration typically involves specifying storage options, such as local file storage or cloud-based solutions like AWS S3.
we are using GitHub to download the Loki you can download it using the GitHub link
https://github.com/grafana/loki/releases/download/v2.9.1/loki_2.9.1_arm64.deb
this link is used to download Loki for Ubuntu 64bit if you are using any other distro find the package according to it from here


#use this to grant the executable permission
chmod +x loki_2.9.1_amd64.deb
#And install it
sudo dpkg -i loki_2.9.1_amd64.deb

#check loki is runnig or not using
sudo systemctl status loki
#if not runnig use
sudo systemctl start loki
Install Promtail: Similarly, Promtail can be installed on the same machine as Loki or distributed across multiple nodes. Configure Promtail to tail your system logs, specify labels, and point it to your Loki instance.
we are using GitHub to download the Promtail you can download it using the GitHub link
https://github.com/grafana/loki/releases/download/v2.9.1/promtail_2.9.1_amd64.deb
  #use this to grant the executable permission
  chmod +x promtail_2.9.1_amd64.deb
  #And install it
  sudo dpkg -i promtail_2.9.1_amd64.deb
  #check Promtail is runnig or not using
  sudo systemctl status promtail
  #if not runnig use
  sudo systemctl start promtail
Configuration File:
Promtail is configured using a YAML configuration file. Create a
config.yamlfile (or any other name you prefer) and open it in a text editor. Here is a basic configuration example:sudo nano /etc/promtail/config.ymlConfig.yaml
    server:
      http_listen_port: 9080
      http_listen_address: 0.0.0.0

    positions:
      filename: /tmp/positions.yaml

    clients:
      - url: http://localhost:3100/loki/api/v1/push

    scrape_configs:
      - job_name: syslog
        static_configs:
          - targets:
              - localhost
            labels:
              job: syslog
              __path__: /var/log/syslog
Note: under scrape_configs: section write
- job_name: syslog
static_configs:
- targets:
- localhost
labels:
job: syslog
__path__: /var/log/syslog
For custom path in job: section you can give the path of desired location from where you want to fetch the code
Visualizing Logs with Grafana
With Loki and Promtail set up, the next step is to create insightful visualizations and dashboards using Grafana:
Create Data Source: In Grafana, configure Loki as a data source. This allows Grafana to query logs from Loki. Specify your Loki endpoint and authentication details if required.

- In url section add the URL of Loki in my case loki running on my localhost and save it
Create Dashboards: Grafana's real power lies in its dashboards. Create dashboards tailored to your needs, adding panels that query and display logs using Loki's PromQL language. Use variables to make your dashboards dynamic and filter logs based on different criteria.
now we make our own dashboard
- Click on the new them new dashboard


- click on add visualization and select Loki as data source

Now Select label and click on run query

"Please use the create panel and configure the logs on the dashboard according to your preferences."

Benefits of the Loki-Promtail-Grafana Stack
Now that we've covered the setup process, let's highlight some of the key benefits of using this monitoring stack:
Centralized Logging: Loki and Promtail provide a centralized repository for logs, making it easy to search and analyze logs from multiple sources in one place.
Efficient Storage: Loki's design optimizes storage space by deduplicating log lines, which can be especially cost-effective when dealing with large volumes of logs.
Dynamic Dashboards: Grafana enables you to create interactive dashboards that can be customized to meet the specific needs of different teams and projects.
Scalability: The stack scales horizontally, making it suitable for handling logs from small setups to large, distributed environments.
Real-time Alerts: With Grafana's alerting capabilities, you can receive notifications for critical log events, allowing you to take proactive measures to address issues promptly.
Conclusion
System logs are a treasure trove of information that can help you monitor and troubleshoot your infrastructure effectively. By implementing the Loki-Promtail-Grafana stack, you can centralize your logs, create powerful visualizations, and set up real-time alerts. This combination of tools provides a robust solution for system monitoring and observability, ensuring your systems stay healthy and performant in today's complex IT landscape.
"Next, we will explore how to set up CPU usage alerts. For example, if CPU usage becomes too high, we can configure notifications to be sent via Teams, email, WhatsApp, and other channels."