

AWS DevOps Agent: Real Testing, Architecture & Practical Insights
Search for a command to run...
No comments yet. Be the first to comment.
The Ops Fix Hub is a dynamic series designed to tackle real-world challenges in the DevOps and CloudOps domains. "Breaking Down Barriers, One Ops Fix at a Time."
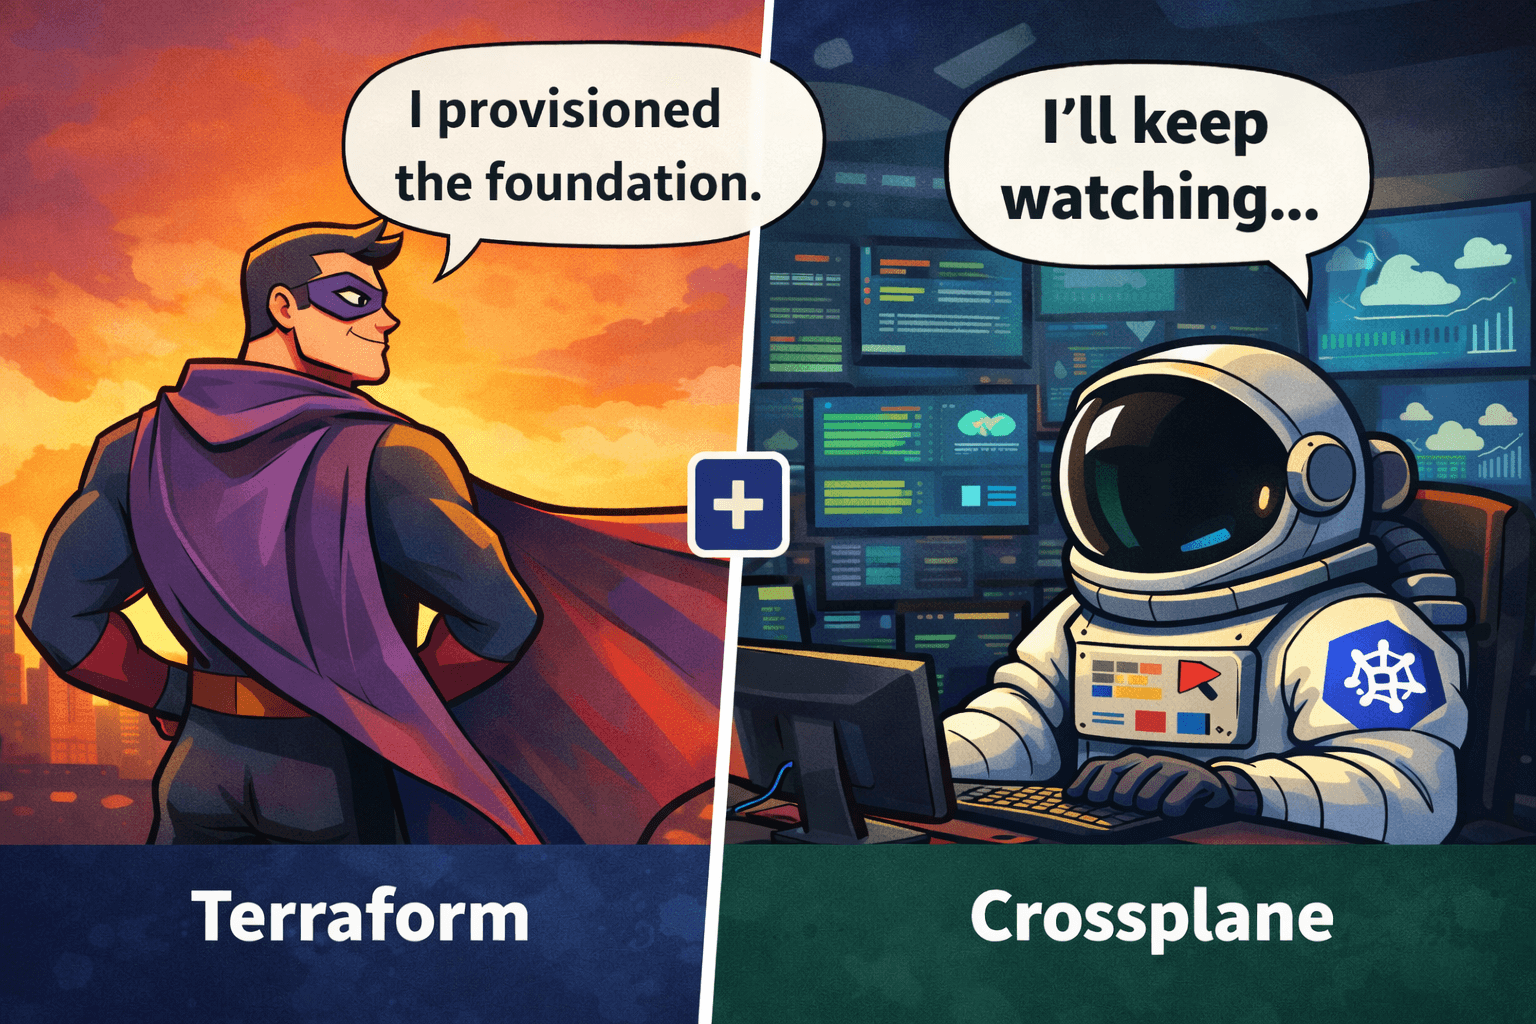
1. Overview What I Designed I designed a hybrid infrastructure architecture: Terraform → Foundation Layer Crossplane → Dynamic Lifecycle Layer ArgoCD → GitOps Enforcement This created a continuou
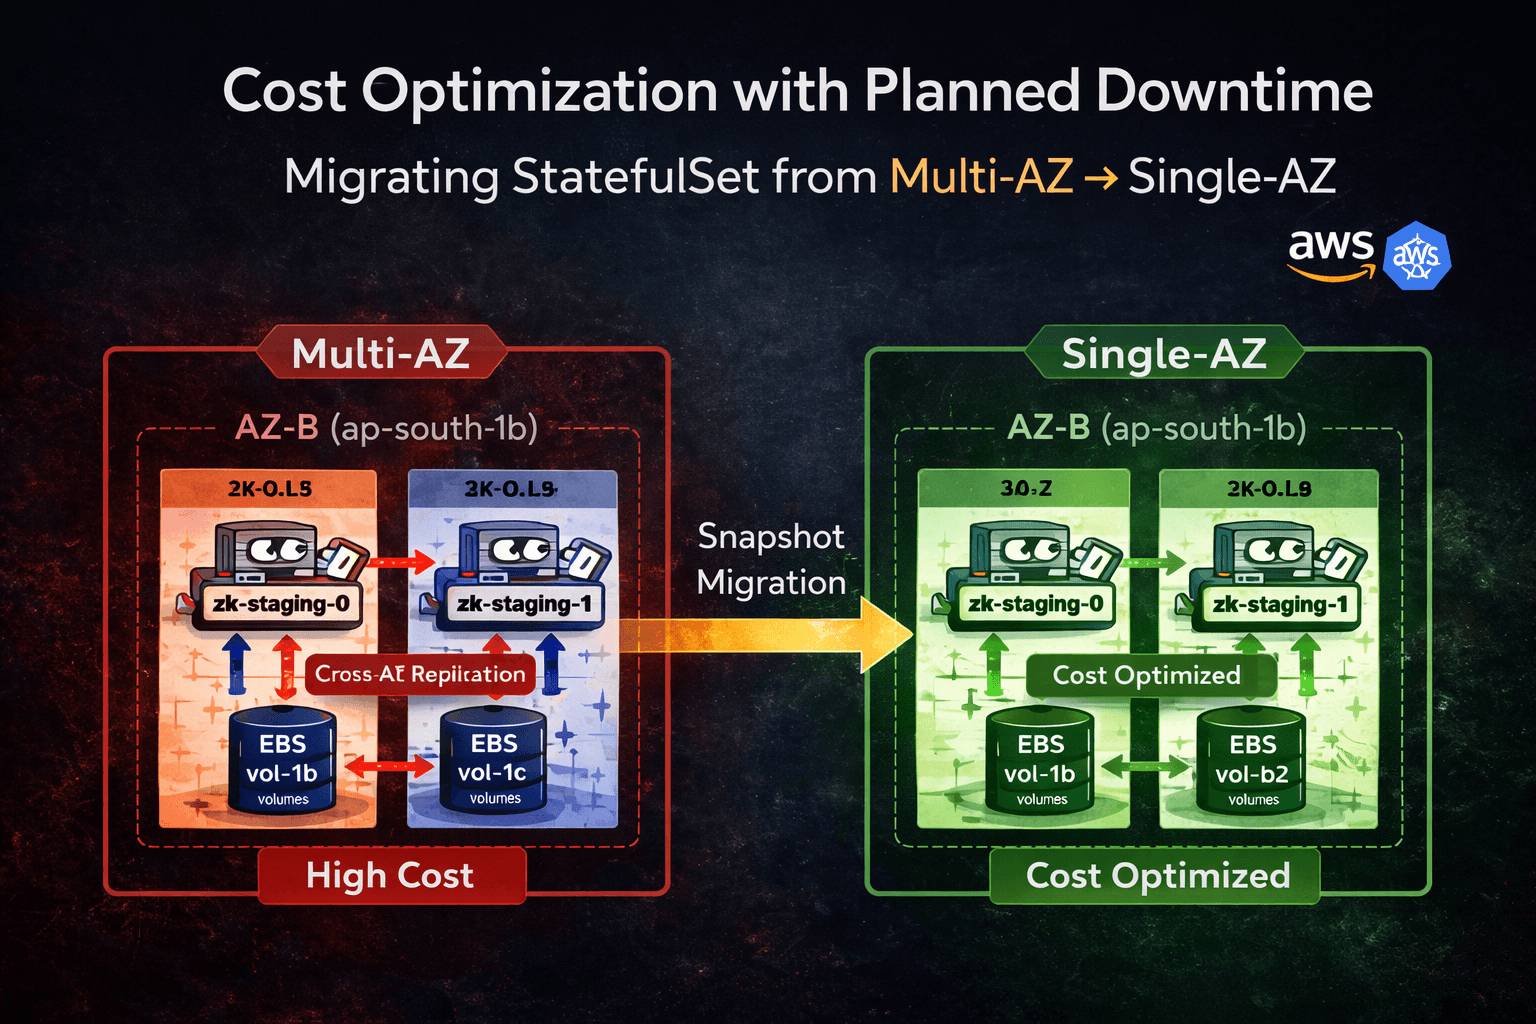
This migration was performed on a production workload where cost reduction was prioritized over zone-level high availability.
1. Overview What I Designed I designed a hybrid infrastructure architecture: Terraform → Foundation Layer Crossplane → Dynamic Lifecycle Layer ArgoCD → GitOps Enforcement This created a continuou
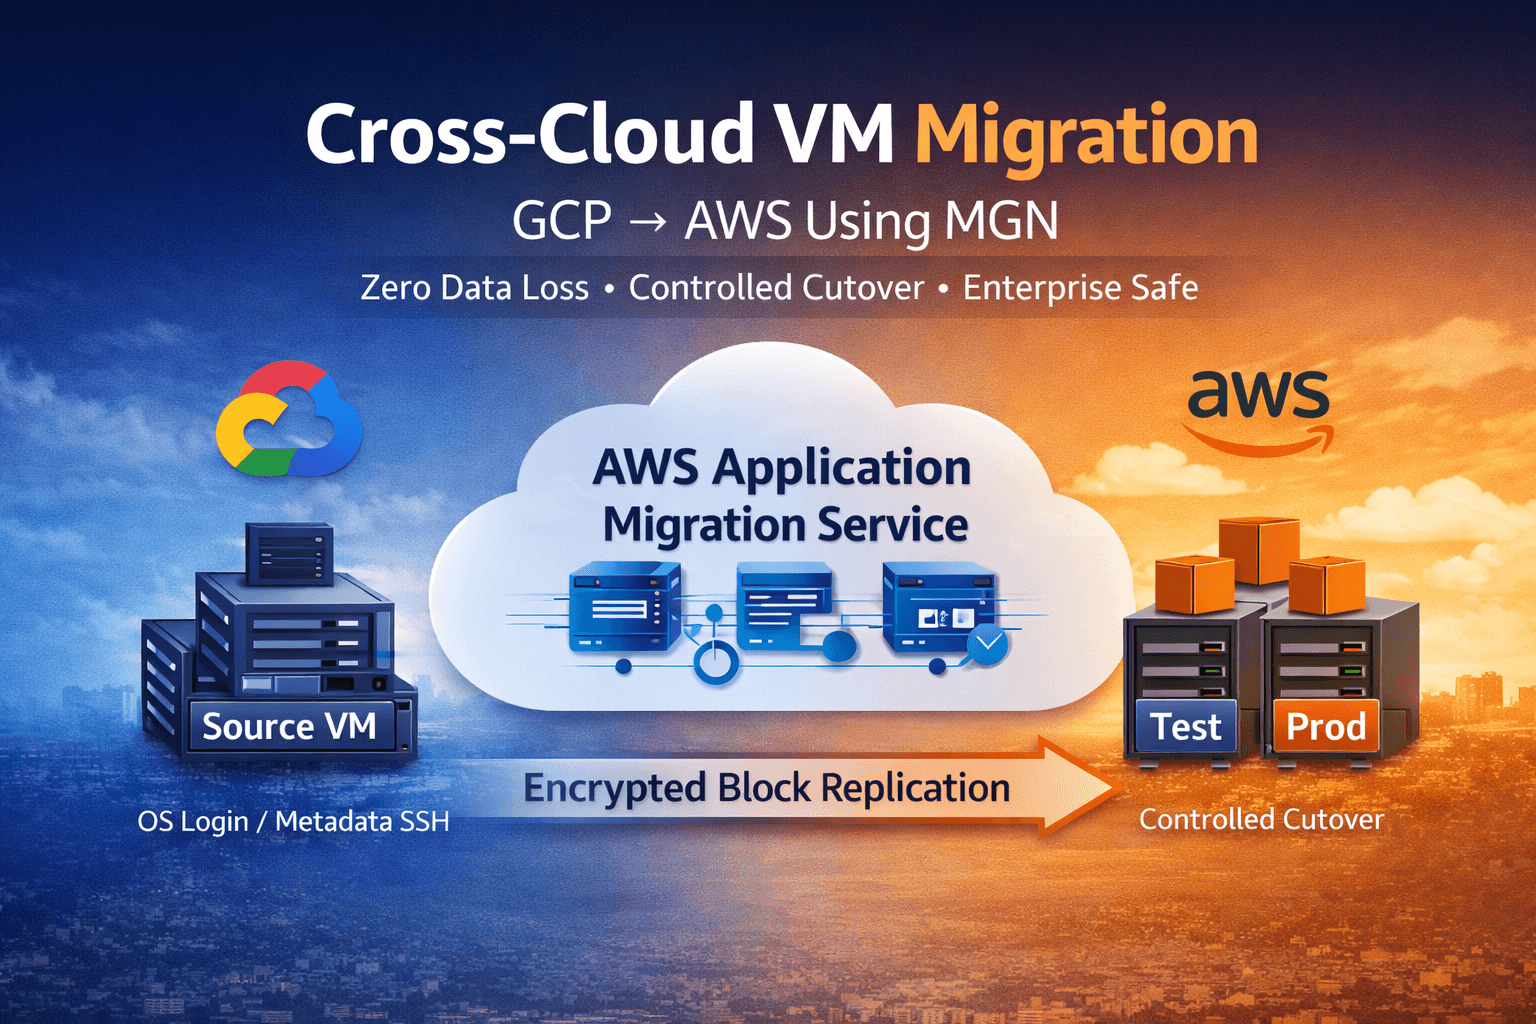
Cross-cloud VM migration is not a disk copy task. It is: An access model transformation A replication lifecycle management exercise A downtime control operation A cost boundary decision We execu
Migrating object storage across cloud providers is not a copy task.It is a cost, network, and security boundary problem. We migrated 10+ TB of object data from Google Cloud Storage to Amazon S3 under
When AWS introduced AWS DevOps Agent, I was less interested in feature lists and more interested in one practical question.
Can it actually reduce investigation time during real production-style failures?
To answer that, I tested it using controlled failure scenarios instead of relying purely on documentation.
What it actually does
How it works architecturally
What I observed during testing
Where it helps
Where it does not
No marketing. Only practical evaluation.
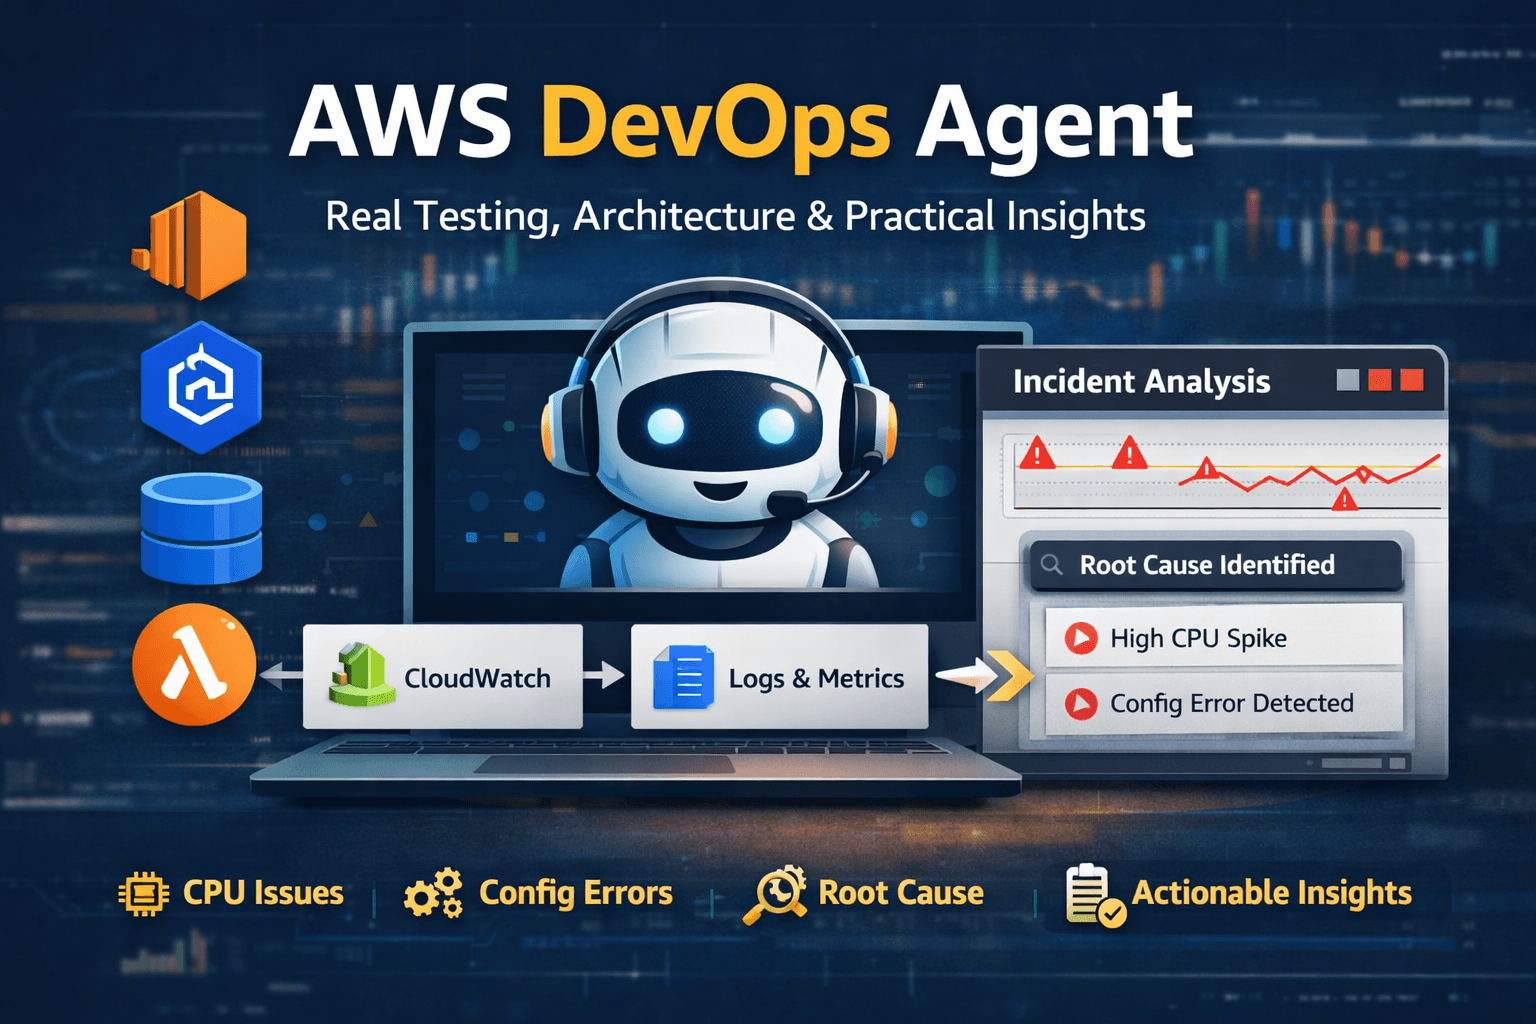
AWS DevOps Agent is an AI-powered investigation capability that analyzes AWS telemetry and generates structured incident timelines with evidence-backed probable causes.
It is not:
A chatbot
An auto-remediation engine
A monitoring replacement
It does not generate telemetry.
It consumes existing signals and correlates them.
Application Workload
        ↓
AWS Services (EC2 / RDS / EKS / ALB / Lambda)
        ↓
CloudWatch Metrics + Logs + Events
        ↓
AWS DevOps Agent Correlation Engine
        ↓
Incident Timeline + Evidence + Root Cause Hypothesis
It acts as a reasoning layer on top of CloudWatch telemetry.
Monitoring detects the problem.
The DevOps Agent explains it.
It does not independently detect incidents — it analyzes them after alerts are triggered.
The DevOps Agent analyzes signals primarily from:
Amazon CloudWatch (metrics & logs)
AWS resource configuration events
Control plane activity
Deployment-related changes
Common services involved during investigation include:
Amazon EC2
Amazon RDS
Amazon EKS
Elastic Load Balancing
AWS Lambda
If metrics and logs are incomplete, investigation quality drops.
Observability maturity directly affects output quality.
Setup
Burstable EC2 instance
Sustained workload applied
Manual SSH session before spike
High CPU alarm
Increased latency
What the Agent Correlated
CPUUtilization spike
CPUCreditBalance drop
Increased NetworkIn and NetworkOut metrics
SSH login event
Conclusion
Sustained workload exhausted burst credits.
This was expected behavior for a burstable instance — not infrastructure failure.
Instead of manually checking multiple dashboards, the agent produced a structured investigation timeline.
Setup
Manual Nginx configuration change
Introduced an invalid directive
Restarted service
Symptoms
Website inaccessible
Instance healthy
No CPU or memory pressure
What the Agent Correlated
Service restart failure
Configuration change event
Application log error
No correlated resource exhaustion
Conclusion
Application configuration error.
Not a scaling or capacity issue.
The agent correctly separated this from the earlier CPU incident.
The biggest benefit was not detection — it was compression.
What normally requires:
Checking multiple dashboards
Reviewing deployment history
Inspecting logs manually
Was presented as a structured investigation narrative.
That compression directly impacts MTTR.
In short, DevOps Agent improves explanation quality — not detection capability.
Timeline Clarity
It clearly shows:
What changed
When it changed
What metrics moved
What correlated
This reduces guesswork during incidents.
Multi-Signal Correlation
It combines:
Metrics
Logs
Configuration changes
Access events
This cross-signal reasoning improves investigation speed.
Issue Isolation
Multiple issues can overlap in production.
The DevOps Agent attempts to isolate causal chains instead of merging everything into one root cause.
That improves RCA accuracy.
No Deep Application Debugging
It cannot analyze:
Business logic bugs
Runtime memory leaks
Thread-level behavior
Unless those signals are exposed through telemetry.
SSH Blind Spot
Commands executed via SSH are invisible unless command logging is enabled.
Proper logging discipline is required.
Observability Dependency
Insight quality depends on:
Log completeness
Metric granularity
Tagging consistency
Retention strategy
Weak telemetry produces weak conclusions.
Because it operates on CloudWatch telemetry, overall cost is tied to observability depth.
Cost drivers include:
Log ingestion volume
Metric storage
Retention duration
The DevOps Agent itself is not the primary cost driver.
CloudWatch log ingestion, retention policies, and metric granularity determine overall observability spend.
Organizations must balance investigation visibility with cost control.
Best suited for:
Multi-service AWS architectures
Teams handling frequent incidents
Organizations aiming to reduce MTTR
Standardizing RCA processes
Less useful when:
Infrastructure is extremely simple
Logging is minimal
Systems are mostly outside AWS
AWS DevOps Agent should be positioned as:
An investigation accelerator
A structured reasoning layer over telemetry
An MTTR reduction enabler
A standardization tool for incident analysis
It does not replace engineers.
It amplifies the quality of your existing observability.
It is most effective in mature environments with structured logging and tagging standards.
Strong telemetry in → structured reasoning out.
Weak telemetry in → weak conclusions out.